Hello everyone, this is a short blog series/course that I’ve made to kind of regurgitate the knowledge I’ve learned in the past few months while I was into malware development. Before you move on, you should have a good understanding of the fundamentals of c/c++, WinApi programming, and be familiar with tools with tools like Process Hacker and debuggers. You can easily find books and tutorials online that will solidify your knowledge so I recommend that you check those resource out first.
So before we move on, let me address this question: “Why should we even write our own custom malware?” Well, as AV’s and security products advance throughout time, it become vital as security testers that we write our own custom code to evade such defenses. Tools like Metasploit are heavily signature by AV’s and therefore will be easily caught in its raw form. Throughout this blog post series, I will try to cover the basics in malware development and evading such defenses from AVs and security products.
For a quick and VM setup, you can grab one here rom Microsoft’s website: Virtual Machines — Microsoft Edge Developer. Windows 10 recommended. I personally use Visual studio to compile and x64dbg for a debugger but you can use whatever alternatives you want to use.
Slides to complement are here: Implant Dev and Defense Evasion Course — Google Slides
DLLs/EXEs
DLLs/EXEs are the type of file format we will be using throughout the course to execute our malware. The difference between these two is that EXEs can be loaded into memory as an independent process, but DLLs cannot be loaded into into memory as an independent process and instead need to be loaded into another process. DLLs usually export functions which and EXE file can use. Note these both follow the PE file format which is something we will be discussing later
A code example of a PE/EXE file is this(when compiled into an exe):
#include <windows.h>
#include <stdio.h>
#include <stdlib.h>
#include <string.h>int main(void) {printf("Hello World");

 getchar();

 return 0;
}
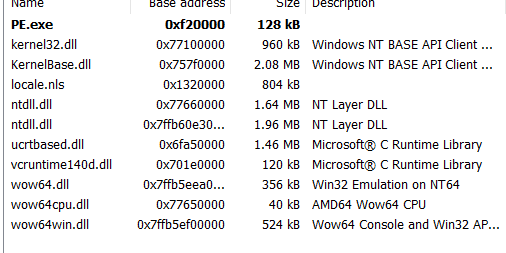
This is a pretty self explanatory piece of code which I don’t need to elaborate further. I recommend you play around with process hacker and see the properties and such of the executable, for example, you can view the DLLs loaded and the memory regions of the process loaded:
Memory(in memory tab):

DLLs loaded(in modules tab):
Now we have the code for a DLL:
#include <windows.h>
#include <stdio.h>
#include <stdlib.h>
#include <string.h>extern "C" __declspec(dllexport) int run(void); // export function
int run(void) {
     MessageBox(NULL,L"attached",L"attached",MB_OK);
     return 0;
}BOOL WINAPI DllMain( HINSTANCE hinstDLL, DWORD fdwReason, LPVOID lpReserved ) { // dllmain is like main switch ( fdwReason ) { // specify entrypoints
   case DLL_PROCESS_ATTACH:
     MessageBox(NULL,L"attached",L"attached",MB_OK);
     break;
   case DLL_THREAD_ATTACH:
     break;
   case DLL_THREAD_DETACH:
     break;
   case DLL_PROCESS_DETACH:
     break;
   }
 return TRUE;
}
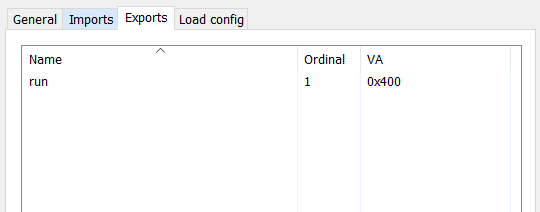
Here, we export a function called “run” in our DLL which will simply popup a message box. When you make a DLL, you can specify an entry point function. This entry point is called when the DLL is detached/attached from a process or a thread. We can specify the code for the entry points in the switch cases, for example in our code, if our DLL was attached to a process, we would popup a simple message box called “attached”. If we compile this DLL and open it in process hacker, we can see its exports like so:
To see what happens when our DLL gets attached, we can inject our DLL in a process which will essentially make a program load a DLL. To do this in process hacker, right click the process you want to inject to, choose miscellaneous, and choose inject DLL in which you will choose the DLL you just compiled. If we inject our DLL into a process in lets say something like notepad, we can see our message box popup:

And if we check the modules of said program:

We can see our DLL loaded named “simple.dll” which caused our message box to popup.
To run our exported function named “go” from our DLL, we can use rundll32 to do this. To do this, the command should be like this:
rundll32 <dllname.dll>,<exported function>In our case, the command will be:
rundll32 simple.dll,run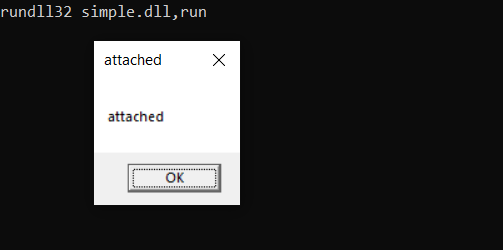
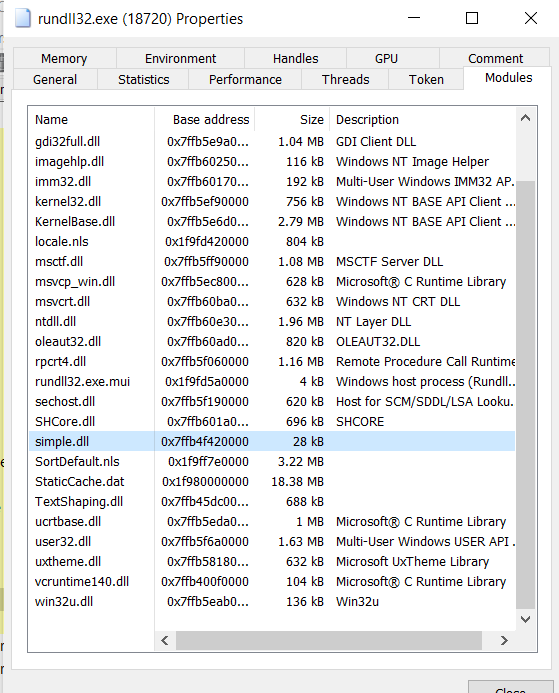
And we can see our message box popup! For the sake of completion, we can see our DLL loaded in the run32dll process in Process Hacker:
PE File
The PE(Portable Executable) file is a data structure which provides the Windows OS loader enough information to run the wrapped executable code. This is the file format that EXEs/DLLs use. This file format incudes information such as linking, API export and import tables, resource management data etc.
A PE file has these things called sections and headers. In a really short explanation, headers are the metadata and the technical details about the executable, and sections hold the contents and are the “meat” of the file.
Some examples of sections are:
- .TEXT: Stores the executable process image, this is where you will find the main entry point of the executable
- .DATA: Stores globally initialized and static variables.
- .RSRC: Stores a whole multitude of objects such as icons and pictures
Note that the PE file is a very complex file format, so I will only go through what I think the most important parts are.
Each PE file starts with the ASCII string “MZ” This field is known as the magic number, and this indicate that it is a MS-DOS compatible file type.
After that, there is this field called e_lfanew. This is a 4 byte offset which indicates points to this signature which indicates its a modern PE file.
Then, there is a COFF File header which contains some information about the OS on how to load it.
Next, we have this field called the optional header. This is a very important field which contains a multitude of information like
- Its exports and imports
- The size the PE file occupies during runtime
- Target Subsystem for an exectuable
Etc.
Then, we have the section table. This contains various information related to the sections available of the executable file.
Finally, we have the actual sections which we discussed above.
For more visual help:

If you are still feeling a bit confused, you can head over to Microsoft documentation about the PE file.
To get a a more hands on approach and a better understanding of the PE File, you can use PE Bear to view information about the PE file. For example, I decide to open notepad.exe in PE bear and a whole bunch of information pops up.
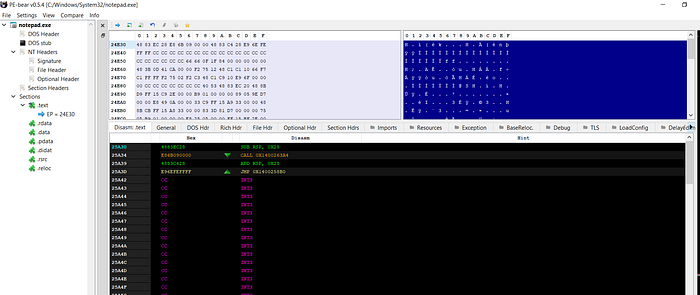
I recommend you play around with PE bear and see how everything connects together to get a better understanding.
Processes and Threads
A process is a running instance of a program, processes only manage, while the threads run the code. Each process is identified by this unique id called the PID.
A process contains the following
- Executable program, this contains the code and data
- Private virtual address space, used for allocating memory
- Primary token, contains the security context
- Private handle table, holds executive objects like events, semaphores and files
- Threads for execution, examples are main/winmain
When another process starts another process, this is called the parent child relationship, where the former is the parent, and the latter is the child. The child has this attribute called the PPID, which is the PID of the parent of the process. We can see this relationship in Process Hacker:

We can see that the parent of the process is explorer.exe, which has a PID of 2940.
Handles
The Windows kernel exposes various types of objects for use to user mode processes and the kernel itself. These objects are data structures which are created and managed by the object manager. The kernel can retrieve a direct pointer to these objects for use, but user mode processes must retrieve a handle to use the object. Handles are an index to an entry in a table that points directly to a kernel object in system space. The reason why user mode processes use handles are because they are used as shields from user mode code directly accessing objects in the kernel.
In the above, we see the handle table for each process to see the handles and objects residing in the given process.
For example, if we want to remotely allocate memory to another process, you must retrieve a handle to do so:
HANDLE hProc = OpenProcess(PROCESS_ALL_ACCESS, FALSE, PID_OF_PROCESS); // retrieve handle from a processVoid * rem = VirtualAllocEx(han_proc, …); // specify handleCloseHandle(hProc); // close handle when you don’t need it for performance reasons
PEB
The PEB is a memory structure which contains a whole bunch of info in the current running process. This is always found at at fs:[0x30] in the Thread Environment Block for x86 processes as well as at GS:[0x60] for x64 processes.
To us, the 2 most important things the PEB contains is the:
- Info about the loaded DLLsand its location in memory
- Command line arguments
Note that the PEB resides in user mode, which means that this can be read/written by a user mode process.
Here is the location of PEB in memory in Process Hacker:

I encourage you to play around with the PEB more in Windbg to get more information about the PEB.
Conclusion
This is a very barebones windows internals post which doesn’t go into much detail about the topics. I have linked some resources below which I recommend you to check out.
Exploring Process Environment Block — Red Teaming Experiments (ired.team)
